
Is the marketing department overloaded with collecting and analyzing client feedback from different sources?
Spend a lot of time comparing your products in detail with competing products?
Do you have no time to track market changes for new players, trends and client requests?

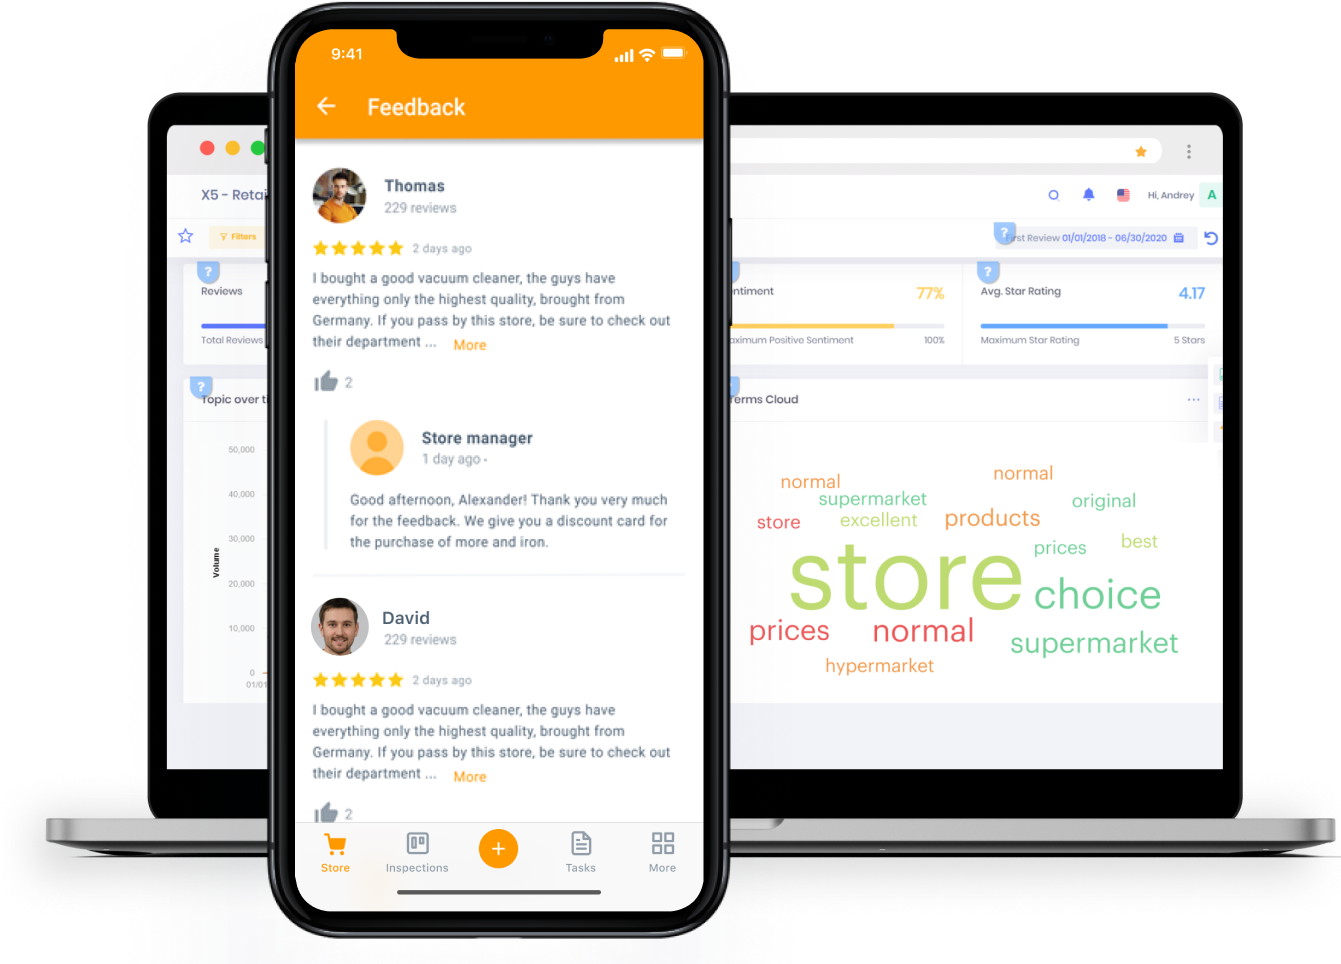
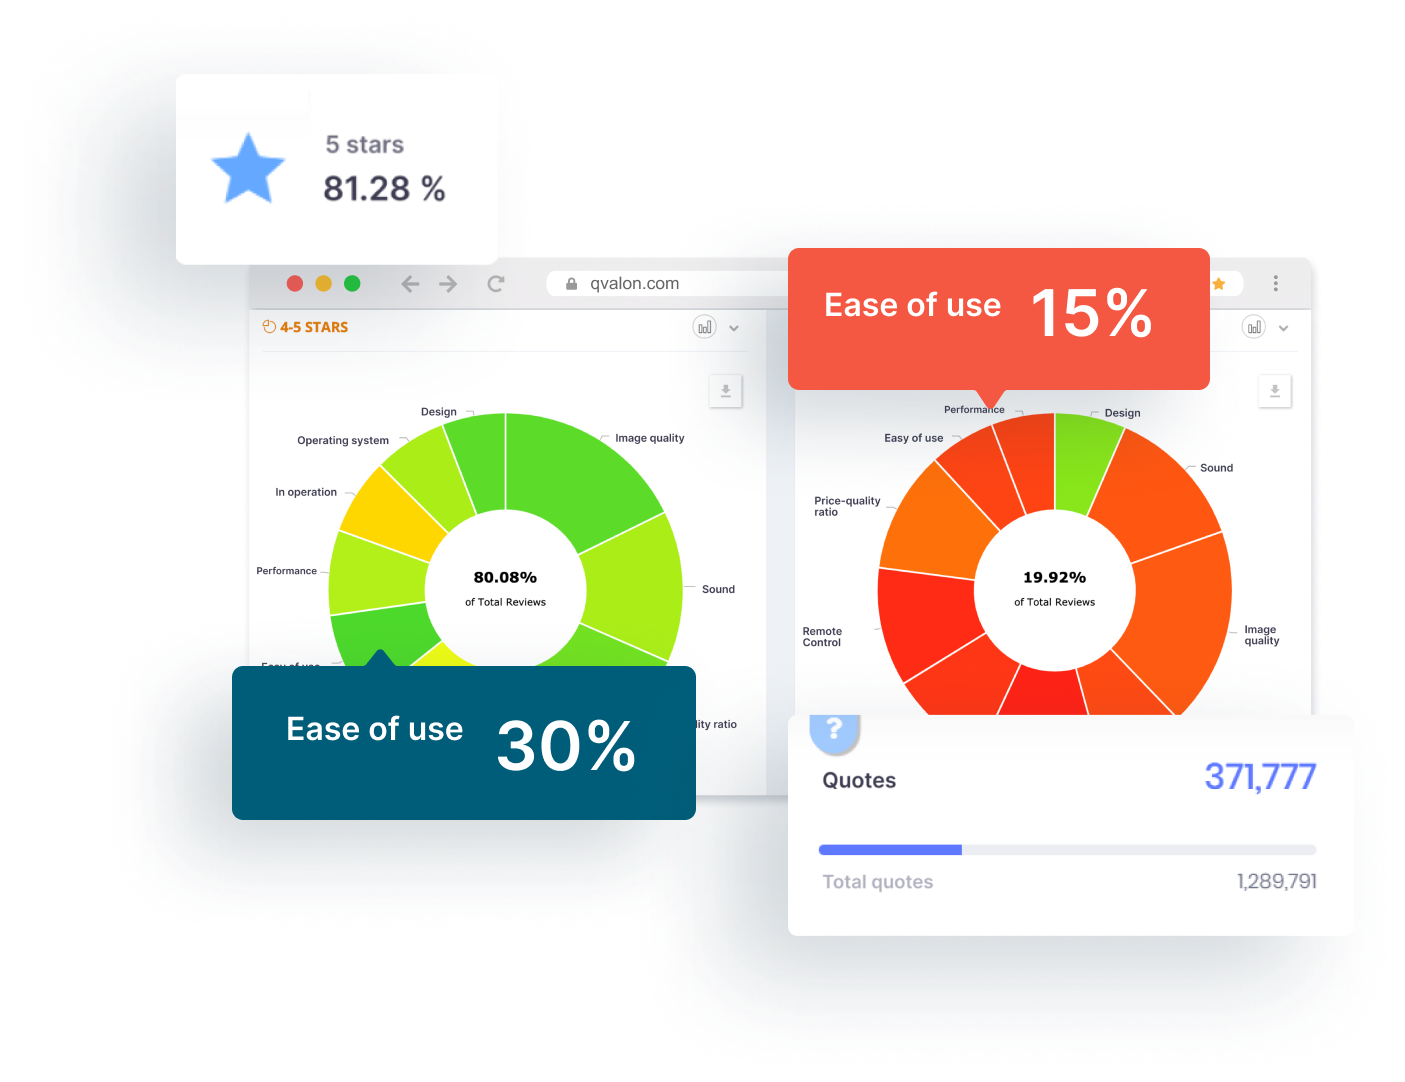
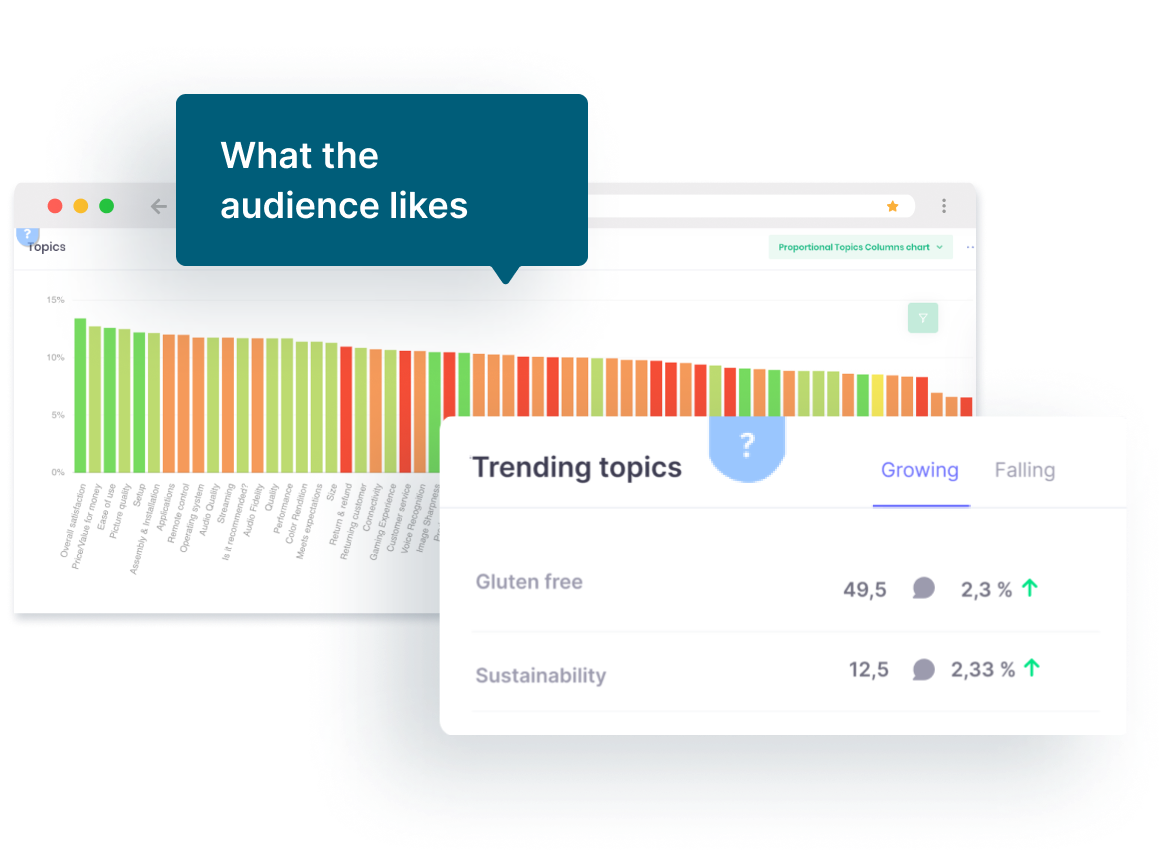
QVALON will automatically collect all available feedback on store location convenience, service quality and product categories in the Web, identify up to 80 characteristics for each product and classify them, pointing out their weaknesses and strengths. Using the analysis data, you will find out what customers like and what is not. This will allow you to manage the product matrix more efficiently.
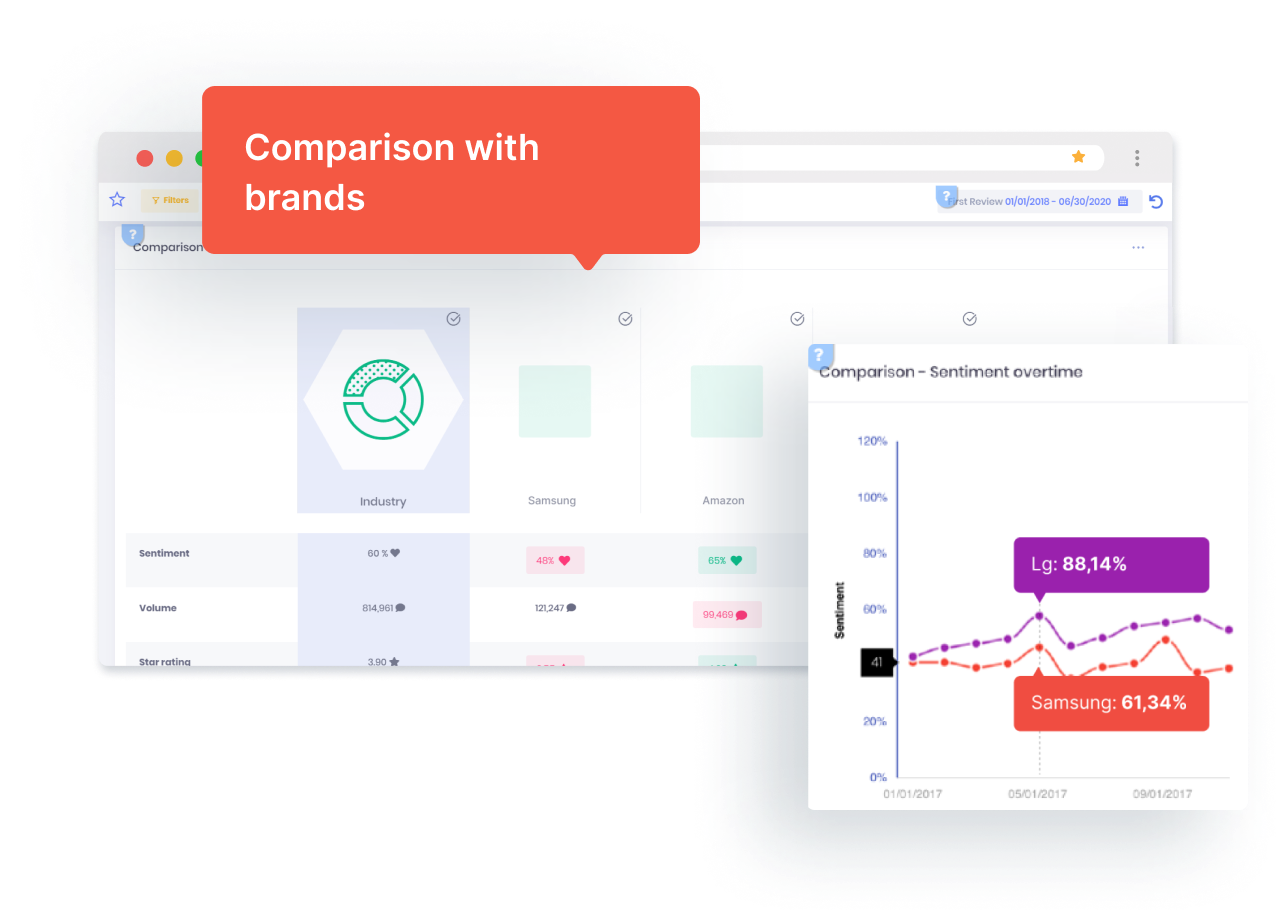
QVALON will provide access to a complete catalog of your industry: all existing brands, products and audience preferences. You will be able to compare yourself with competitors in a variety of features (up to 80 pcs.) and track trends in dynamics by brand, SKU and industry as a whole. You will also be the first to know about the emergence of new competitors in the market.
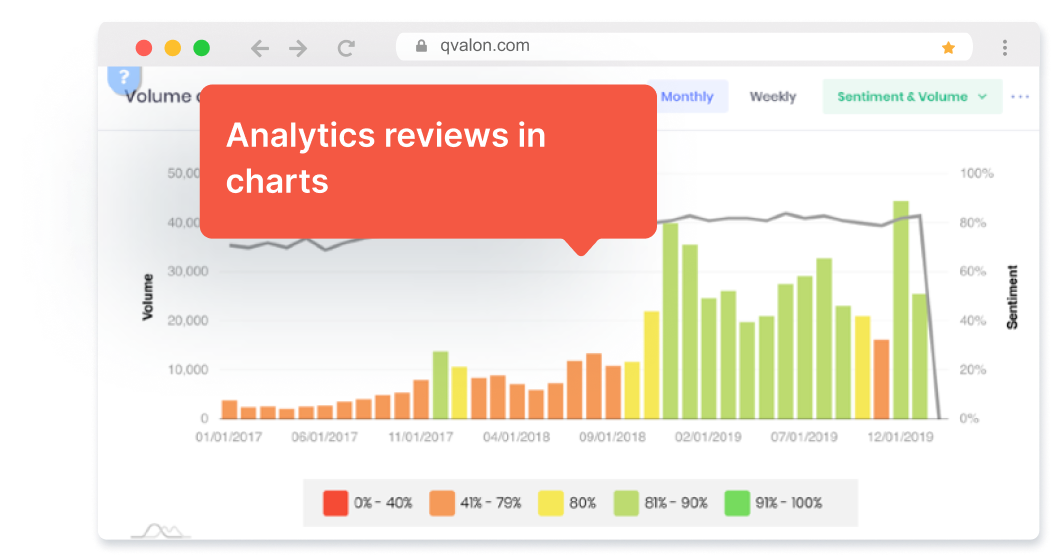
QVALON generates all necessary charts and reports in real time without involving a team of analysts. Thanks to this, you will be able to quickly learn about changes in audience preferences and be able to respond to them: modify the SKU to meet new demands and free niches, strengthen those characteristics that concern your customers most.


 Manual methods
 The final volume of data received within a single survey is processed
The content of the research is limited to the list of questions in the questionnaire, so there is no opportunity to learn something new
Analysis of data from different sources requires different specialists
Analysis of data from different sources requires different specialists
Low feedback analysis accuracy – about 60%
The final volume of data received within a single survey is processed
The content of the research is limited to the list of questions in the questionnaire, so there is no opportunity to learn something new
Analysis of data from different sources requires different specialists
Analysis of data from different sources requires different specialists
Low feedback analysis accuracy – about 60%
 QVALON
 Data is constantly updated - the system regularly monitors the Internet for new feedback
The research includes absolutely everything that consumers say on their own initiative, as a result you can get 8-10 times more insides, compared to manual methods
One system analyzes data from any source: CRM databases, call centers, social networks, feedback sites, surveys, chats, etc.
All data is available at any time to any interested employee
High feedback analysis accuracy — over 90%
Data is constantly updated - the system regularly monitors the Internet for new feedback
The research includes absolutely everything that consumers say on their own initiative, as a result you can get 8-10 times more insides, compared to manual methods
One system analyzes data from any source: CRM databases, call centers, social networks, feedback sites, surveys, chats, etc.
All data is available at any time to any interested employee
High feedback analysis accuracy — over 90%
